Using business continuity software, training and strategy to create value
Few organisations have a dedicated business continuity resource, and even those that do can find themselves underprepared for emergencies when they arise. When reality kicks in and serious events place an organisation in the public spotlight, knowing how to respond can make an immense difference, potentially preserving or damaging a reputation that has taken years to build. With business continuity training, an organisation can build risk resilience and capability without distracting or disrupting normal activities. This case study explains how our business continuity consultancy helped Zurich Global UK, a corporate risk management and financing provider, achieve this.
Background
Zurich Global Corporate UK (GCUK) is a highly successful business unit within Zurich Financial Services, a global financial institution based in Switzerland with a net income of $4.5 Bn. GCUK provides large corporations with tailored global and domestic solutions for risk transfer, risk financing and corporate risk management, using its global network of specialists to build risk management strategies. GCUK operates from offices in London and Whiteley, the latter some 100 miles away on the South Coast, with two very different continuity risk profiles. The London operation retains some 400 market-facing, operational and support staff with a further 150 claims processing and back office specialists based in Whiteley.
GCUK has a mature, professionally managed business continuity capability that enjoys support from the Executive and from counterparts at Group level. The business unit has been indirectly affected by major disruptions in recent years and has a well-rehearsed infrastructure capability. Nonetheless, during a regular mid-year review of current capability, it was concluded that the business as a whole might be better prepared, particularly against events that affected many staff.
Business Continuity Awareness Programme Planning
In response to the review outcome, GCUK’s Risk Manager decided to undertake a fact finding exercise to measure Business Continuity Awareness across the business and hence determine where additional training or activity was required. The programme had five stages as follows.
- Initiation: this entailed establishing initial feasibility, resourcing, tool selection, planning and funding the overall activity. Critical success factors at this stage included:
- Executive buy-in for the programme was established at this stage, providing a mandate for all activities.
- The INONI business continuity management software platform was also selected at this stage and required information Security approval. This was formally obtained using in-house established processes. The tool is currently used by the UK Financial Authorities to benchmark resilience in the financial sector.
The pilot study took place over several elapsed weeks, thereby minimising delay to the project. It culminated in a review meeting where changes to the draft were proposed and reflected in the final live design.
- Design: covering all aspects of the programme from initial specification through to implementation and testing. The methodology used a top-down approach, starting with high-level training and measurement programme objectives, dissolving these into components to deliver results in the required form. Systematic testing against design criteria was carried out by GCUK’s Risk Management team, providing feedback of changes and improvements.
- Pilot study: providing design and operational validation with critical feedback by a representative cross section of GCUK staff. Pilot group selection was seen to be an important factor and was based on the following criteria:
- Group size: 10 participants were invited and took part in the pilot; this number was sufficient to provide an initial assessment of system and results adequacy, whilst remaining manageable.
- Participant mix: a representative cross-section of staff were invited to participate; these included management, professional and administrative staff, providing different perspectives and insights. The pilot study took place over several elapsed weeks, thereby minimising delay to the project. It culminated in a review meeting where changes to the draft were proposed and reflected in the final live design.
- Roll-out: delivering the survey application to all staff. This involved an initial email communication with all staff, briefly explaining the rationale, timing, expectation and executive support for the programme, backed up by appropriate reference material on relevant Intranet web pages. Logons to the survey application were emailed to individuals in staged groups for completion. The GCUK Risk Management team provided overall system administration, monitoring uptake and completion via the online system dashboard.
- Reporting: involving survey application closure and taking an export of the results database offline for detailed analysis using MS Excel.
Design
A number of factors critically influenced the overall shape and delivery of GCUK’s Awareness Programme. Key aspects of these are identified and discussed here.
- Testing versus learning: the programme’s core objective was raising corporate awareness of business continuity, with training needs analysis as an additional benefit. This basis for measurement allowed for discussion with colleagues; research of responses using documents and Intranet were encouraged and no aspect of interaction was viewed as ‘cheating’. In other words, all metrics were based on resulting awareness as opposed to initial awareness.
As an additional control, the system prevented committed responses from being altered by individuals once they had seen their results. This helped ensure that responses were based on actual awareness and not adjusted by outcome. - Material Content: inevitably, the awareness generated through participation determined the programme’s overall value to the organisation, so on the one hand it was tempting to populate the survey with high-value BCM material. However, this was balanced against the risk of overloading participants and generating a negative effect, deterring completion and future involvement.
In terms of wording, the programme’s target population has a unique culture and profile; survey content therefore had to be couched in terms that were relevant for all, amenable and unambiguous. Language and phraseology needed to be appropriate for all staff members, including senior executives, professionals, support and temporary staff. Few had in-depth knowledge or experience of business continuity, requiring removal or rephrasing of acronyms, jargon and assumed knowledge. GCUK’s situation, environment and business circumstances were also reflected throughout the survey application, with a view to ensuring realistic interpretation of questions for all participants.
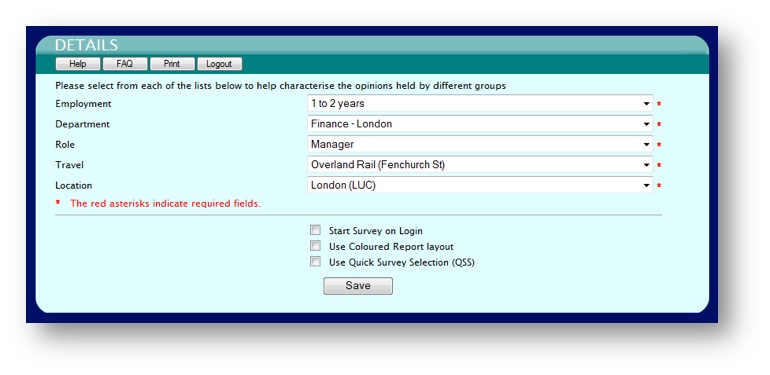
Questions were therefore correspondingly straightforward and factual, offering participants a strong expectation of a positive outcome (actual survey questions are detailed in subsequent sections). - Interpretation: the programme’s high-level objectives included identifying the basis for possible awareness trends. These were reflected in the design as segmentation criteria, identifying period of employment, department, role, location and mode of travel to work. Figure 3 below illustrates how these were collected.
These variables were used during results analysis to cross-refer against actual responses, allowing possible trends between awareness characteristics and individual or group situations to be explored e.g. “the survey suggests that the seasonal staff hired to deal with deadline-driven legal insurance renewals are much less aware of emergency procedure than their permanently employed colleagues”. The charts in later sections clearly illustrate how these data were used in the evaluation of results. - Participation: 80% completion was achieved and this high value was ascribed to a number of incidental and designed-in components, including an ingrained awareness of BCM by staff arising from exposure to events including 7th July terrorist bombings and other background involvement in BCM. Detection, encouragement and prompting of late responders by the Risk Management Team also helped in achieving this positive result.
Executive backing was obtained from the outset and was visibly reinforced through normal reporting and visible participation, generating valuable PR for the programme. Notwithstanding this, the basis for participation remained voluntary, defusing the effects of resistance and minimising the need for administrative policing. The GCUK Risk Management team in any case used the system to detect non-completers and assist those who were willing to participate.
Roll-out of the survey application to staff was carried out on a staged basis, releasing it initially to relatively small groups or functions known to be relatively supportive and/or inherently knowledgeable. This had the effect of seeding the business with positive reaction and confirming the benign and beneficial nature of the programme. Subsequent roll-out to larger groups ran smoothly.
The activity was designed to be capable of completion by a reasonably competent individual in less than 10 minutes or via a number of visits if required.
Feedback in the form of online graphs and reports was made available immediately on completion of the survey activity. The decision to provide this capability was made on the basis that a single interaction would be favoured by many busy staff. It was also judged that the promise of instant results would provide an incentive for many, on the understanding that by investing a relatively small amount of effort individuals can receive useful advice or affirmation.
Segmentation variables
- Communication: managing participation by 500 individuals was viewed as potentially time-consuming, with a successful outcome relying on a highly phased, streamlined and automated approach. The programme’s communication plan provided a sound basis for this.
Email was used to initiate the programme, providing staff with the necessary introduction and instructions to participate. It was also used to distribute login details to groups when they were invited to begin their activity. Communication was maintained following logon via welcome messages, each configured to display an introduction to participants the first time they accessed the system. These provided keystroke guidance and points of contact in case problems were encountered, and could be redisplayed by users at any time.
The system also provided a comprehensive programmable facility for managing frequently asked questions (FAQs). These were initially anticipated by the project team and then supplemented with new items as they were raised by users (although there were very few of these). Again, participants could view FAQs by clicking a button at any time. An intelligent Help facility was also provided and offered context-sensitive support for any situation encountered by participants or administrators. Hover text was associated with prompts and could be programmed for questions, although this was not used for this straightforward application.
Finally, Intranet pages provided two important communication capabilities; firstly, they conveyed programme status to the business on a week-by-week basis; secondly, they provided participants who completed the survey with a more detailed optional source of advice and guidance information accessible via hyperlinks embedded in their reports.
Business Continuity Awareness Survey
A total of just five continuity-related awareness questions were authored by the risk management team to comply with the design criteria; specifically, they were designed to be quick, friendly and engaging to answer, stimulating discussion for a short period in every department and consequently raising awareness. Each question addressed a relevant awareness factor reflecting current global standards and yielding valuable profiling metrics. The table shows the five metrics, their underlying questions, and those ultimately delivered to the participant population.
|
Metric |
Question |
|
Drivers |
Why do we embrace BCM? |
|
Coverage |
What is the scope of BCM? |
|
Contents |
What should we include in BCM? |
|
Planning |
Do you know how to respond to a continuity event? |
|
Procedure |
Do you know how to react to an incident? |
The first three of these each offered participants a list of possible responses, including some incorrect answers. Others were intentionally designed to make the activity more memorable by the inclusion of some offbeat options.
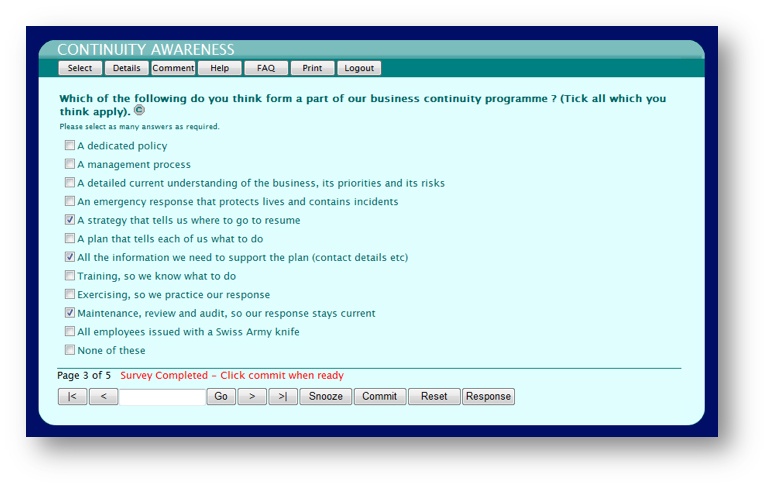
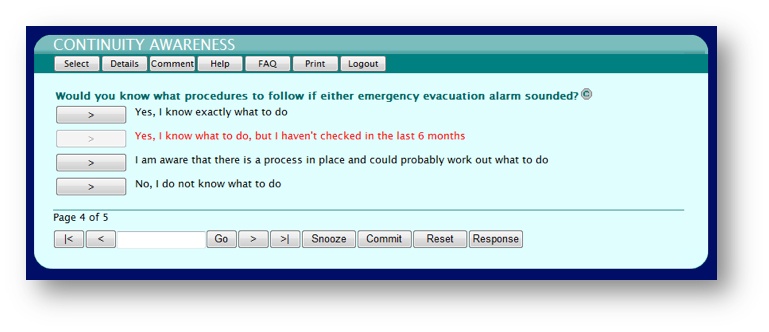
The Planning and Procedure question shown below required single correct responses and provided a powerful insight into those who relied on ‘following the crowd’ in an evacuation.
Business Continuity Survey Results
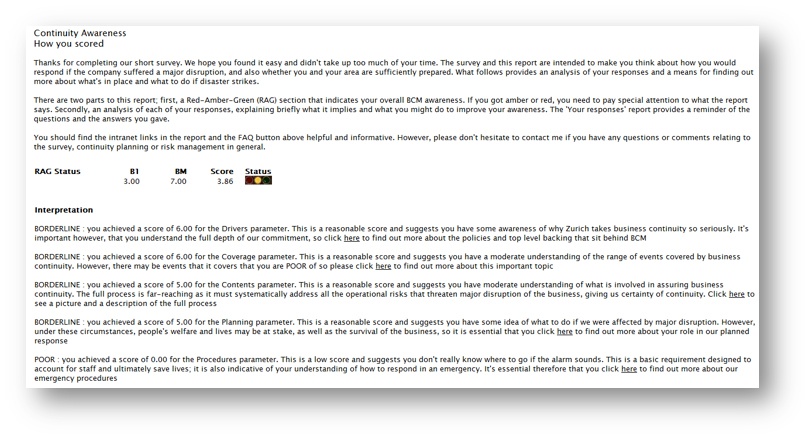
On completing the questions and committing their responses, each participant immediately received access to two online reports and a graph; the latter positioned their score against other departmental averages so they could see where they stand. The former provided a text record of their responses, and a personal evaluation against the corporate standard of what they should do next, illustrated below.
This feedback was again designed to be friendly, positive and engaging, providing each individual with objective advice and guidance they could sensibly act upon. Similarly, the online graph provided a high-level view of where they stood against average cross-departmental scores.
Each metric in the evaluation report contained a hyperlink to a relevant GCUK risk management intranet web page (appearing in each paragraph as underlined here). These pages were specially constructed to provide an initial refresh of required knowledge in each of the challenge areas, ensuring a consistent understanding by all who visited them. Again, the page texts were designed to be straightforward and easily assimilated by staff at all levels.
Example Report
Management Information
The system’s online dashboard provided risk and continuity management with a real-time overview of survey-related activities during the programme, allowing local constant monitoring of both completion levels and scores. This allowed the GCUK Risk Management team to identify and encourage slow-to-respond participants and gain early warning of areas where BCM appeared to be misunderstood, or where buy-in appeared to need improvement. In the few cases where this was needed, the dashboard’s drill-down capability provided insight into why problems were arising before intervening.
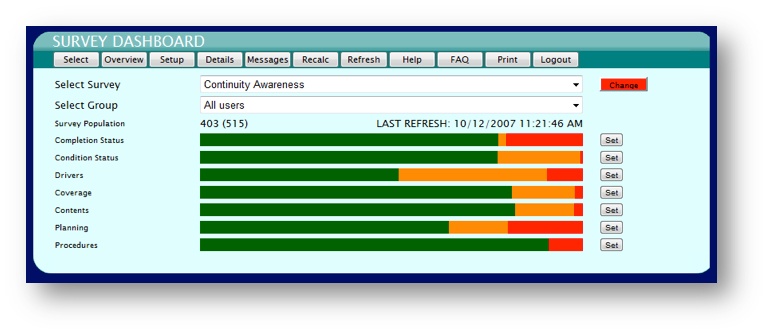
Key indicators in the Dashboard include:
- The number of invited and actual participants.
- The high percentage of benchmark-plus overall respondents shown by the green portion of the Condition bar.
- The small number of nil-scorers on the procedures metric.
Analysis
Further analysis of results took place off-line, achieved by exporting the completed survey and providing an accessible and familiar database in MS Excel. This contained pre-prepared pivot charting, allowing manipulation using each of the in-built segmentation criteria, metrics and other designed-in survey variables. The pivot charts were used to manipulate the data and highlight important issues, some not explicitly within the programme’s initial remit. The key offline analyses are illustrated and explained briefly below.
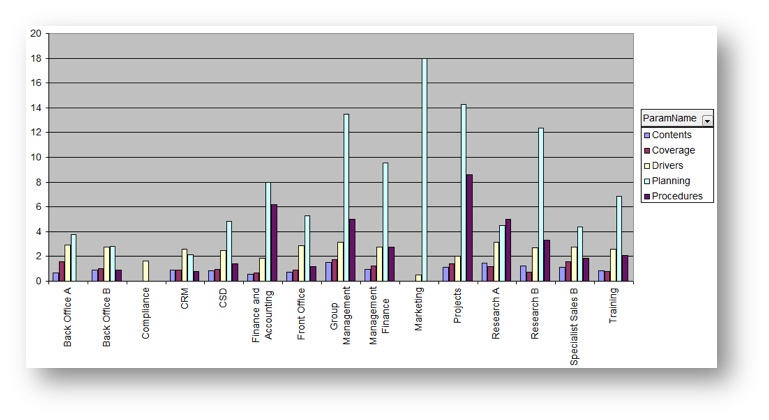
It was noted in retrospect by the GCUK Risk Management Team that the potential for slicing and analysing the tool’s results is extensive and that this aspect should be understood from a business perspective before launching the survey and factored into the initial design. Not all views of the output will be relevant to all cases. The following section reflects this and is demonstrative of the functionality of the tool as in this case the Team decided to only use a subset of the available results, specifically relating to potential for improvement. Four chart examples are shown here:
- Department improvement scope
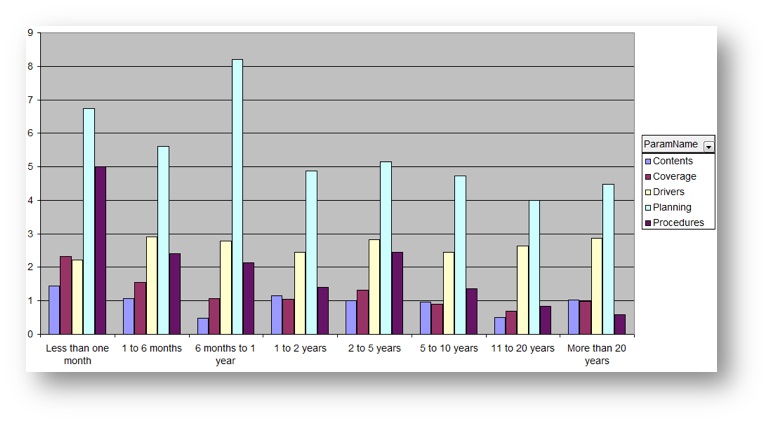
- Awareness due to employment longevity
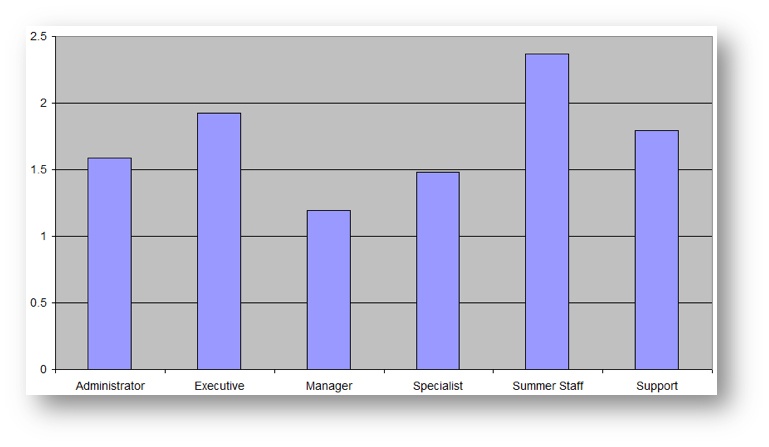
- Individual role awareness
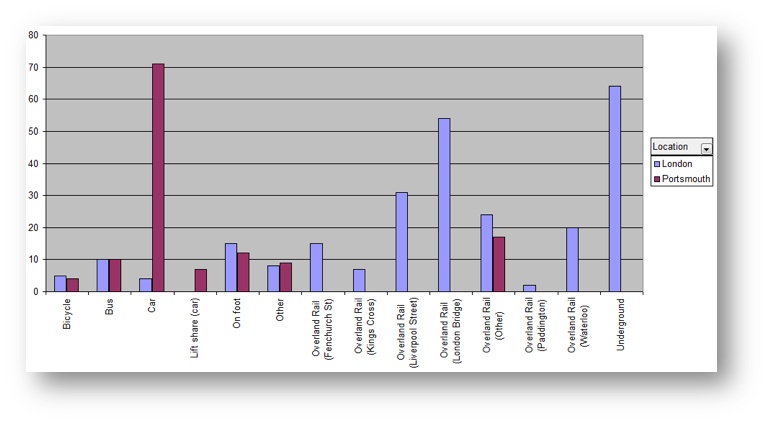
- Distance travelled to work - an example of useful derivative information
Department scope for improvement
This chart shows the areas in which respective departments have greatest scope for improvement (department names altered). It shows clearly those areas requiring attention and profiles the training they should receive.
Duration of employment
This chart shows an improvement potential indication, showing how the five components of BCM Awareness are each affected by duration of employment. Again, there are discernible trends showing improvement with time served, adopting a steady level after one year. Employees of less than one month (mainly summer staff in this case) would appear to need specific procedural training, reflecting expectations.
Improvement potential
The next chart indicates overall awareness improvement potential by participant role, suggesting that management (BCM Team Leaders) scored highest. Overall, GCUK’s average awareness rating was 84.5%. This was the profile considered to match GCUK’s objectives most closely.
Travel to work
This fourth chart provided useful spin-off information regarding staff means of travel to place of work. A fuel strike would affect operations at Whiteley far more than London, whereas rail closures would have a converse effect. This information will be used to sense check existing business impact analysis (BIA) and Strategy documentation to ensure this continues to be reflected.
Conclusion
Overall, the programme provided a valuable and detailed insight into business continuity awareness in a successful global insurance organisation. The results are positive and reaffirm management’s belief about the high level of preparedness amongst staff generally.
The programme’s 400 participants and 80% uptake confirmed that most staff have a shared understanding of, and an appreciation of the importance of knowing what to do if an incident occurs.
The programme required negligible travel or interviews and consumed a minimum of management time. The INONI tool made delivery straightforward, requiring little in the way of training or administration. Future activities should require still less effort, with the possibility of straightforward question changes to explore similar and different areas of interest. The presence, design and content of purpose-built Intranet guidance pages, along with the ability to channel participants directly to them were considered critical success factors for the programme.
A post-survey review confirmed various other specific findings, including:
- The graphs suggest the need to focus on raising specific important aspects of Planning-related awareness as a priority, albeit for a small minority of staff.
- Staff working at City locations appear to have different (not better or worse) awareness profiles from those at regional sites. These suggest they may require separate identifiable training patterns and materials.
- Whilst the majority of staff were conversant with BCM concepts and ideals, some were unaware of where to go and what to do in a crisis. This showed as a departmental trend, with operational staff generally scoring better.
- Some business areas initially resisted participation, citing other more pressing priorities. These were advised and encouraged with appropriate tact and diplomacy, which worked.
- Sample size and statistical consistency were acceptable, with a standard deviation for all responses of 0.2. This fell to 0.15 for the Contents and Coverage metrics and rose to 0.36 for Planning, backing up the need for awareness-raising in this specific area.
Additional follow-up actions included:
- Detailed results to be published on the GCUK Risk Management intranet.
- Focussed management communiqués to be published to provide guidance
- Seasonal staff (critical to business during peak times) to receive specific training at the start of their employment.
Local risk management now owns a clear map of BCM awareness and can plan the form and content of education to be delivered to respective areas of the business. The immediate online feedback reinforced this, creating a level of accountability amongst participants. GCUK also now owns a useful BCM cultural indicator that could allow comparison with other divisions or organisations; it has also satisfied a key governance requirement.
Watch our videos on improving business continuity here:
